
The Future of Urban Deliveries
Quick stat: Fuel cost savings: Up to 70% with electric delivery. Market growth: Urban delivery demand growing at 30% annually. Current delivery mode: Over 2.7 million ICE motorcycles run on petrol in Kenya. Digital delivery market size: Online food and grocery delivery generated US$103 million in 2023
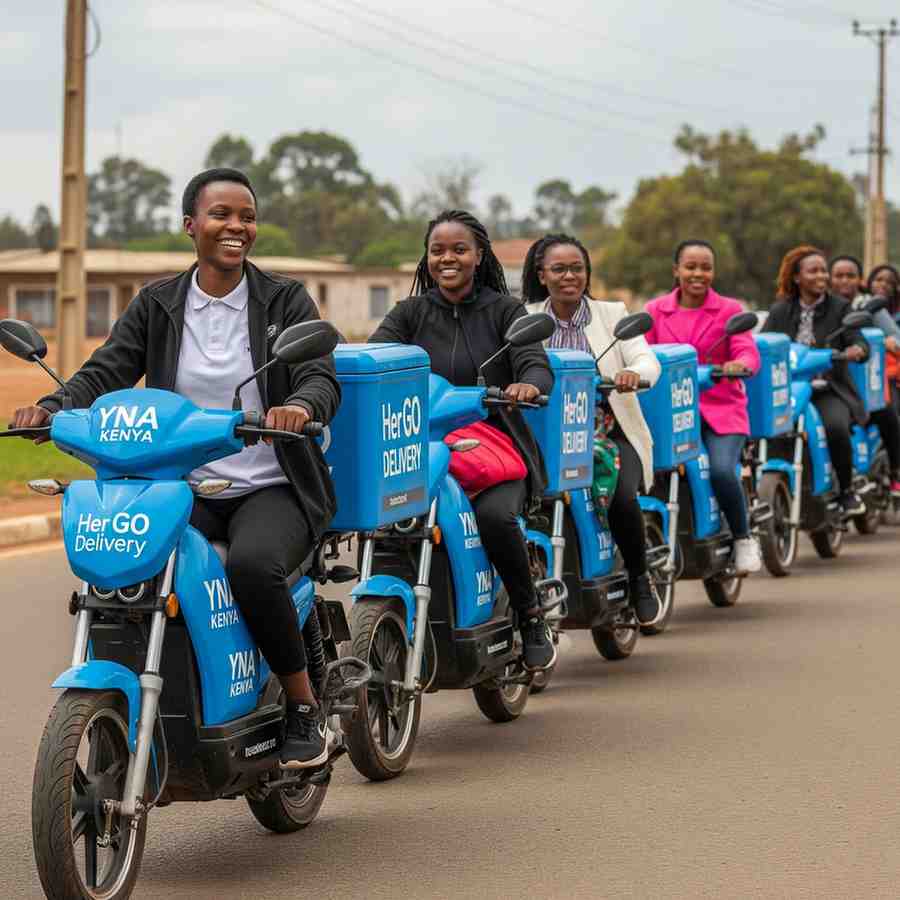
Nairobi’s commerce runs on movement. The challenge? Getting goods the final few kilometers—fast, affordable, and clean. Yna Kenya’s all-electric fleet and solar-powered battery swapping network are built precisely for this moment.
Page 1 — The Last-Mile Challenge in Kenya
Last-mile = most expensive & complex part of delivery: congestion, stop-and-go driving, and failed first attempts push costs up and reliability down—especially for SMEs that compete on speed and price.
Kenya’s online food & groceries segment has surged as consumers expect on-demand convenience. A 2024 Competition Authority of Kenya (CAK) market study found the space generated significant revenues in 2023 and ranked delivery speed as the top consumer priority, with delays among the most frequent complaints. The growth curve through 2027 implies mounting pressure on platforms and SMEs to optimize the final leg of delivery.
Congestion carries a billion-dollar price tag: estimates from Nairobi’s transport authorities and academic work have repeatedly pegged the annual cost of gridlock around ~USD 1 billion when lost time, fuel, and productivity are tallied—drag on margins and urban quality of life.
Environmentally, transport is Kenya’s single largest source of energy-related CO₂. Petrol two-wheelers dominate the urban last mile but are noisy and emissions-intensive. Cutting emissions in this segment delivers outsized air-quality and climate benefits right where people live and work.
Page 2 — Yna Kenya’s E-Mobility Solution
Yna Kenya tackles speed and sustainability together with an integrated system:
- Electric fleet built for cities: nimble e-motorcycles outpace vans in congestion and squeeze through narrow streets. Zero tailpipe emissions cut noise and local pollution on delivery corridors.
- Solar-powered battery swapping: riders swap depleted batteries for full ones in under a minute, eliminating charge downtime and keeping utilization high—all powered by the sun.
- IoT + AI dispatch: live battery state, location, and demand signals feed routing that reduces trip time, missed deliveries, and energy use.
- Carbon intelligence: verified CO₂ savings are logged and tokenized via the Net Tribe Carbon System, turning climate impact into a balance-sheet asset.
Operational edge: swapping + routing optimization lifts courier uptime, improves on-time rates during peak traffic, and enables stable pricing less exposed to fuel price shocks.
Page 3 — Sustainability + Unit Economics
Why electric last-mile wins
- Lower variable costs: electricity (especially solar) is cheaper and more predictable than petrol. Fewer moving parts reduce maintenance events.
- Higher asset turns: sub-minute swapping compresses idle time, driving more deliveries per rider per day.
- Brand + compliance upside: merchants gain measurable Scope 3 delivery reductions—valuable for ESG reporting and climate-aligned procurement.
Air-quality dividend: cleaner last-mile corridors reduce PM2.5 exposure—linked with preventable mortality in Nairobi—while shrinking transport’s CO₂ share.
Page 4 — Market Signals & 2030 Outlook
- E-commerce keeps climbing: Kenya’s online food & groceries and wider e-commerce categories continue to expand through 2027 as digital payments and logistics mature, raising the delivery bar for speed and reliability.
- Swap networks hit scale: Nairobi has crossed the psychological threshold of 100+ battery-swap stations, proving city-scale viability for e-two-wheeler operations.
- Electrification S-curve: New motorcycle registrations in Kenya are seeing a rising EV share, indicating cost parity momentum and ecosystem confidence.
- Same-day/next-hour delivery becomes standard across major Kenyan metros; electric two-wheelers dominate short-haul urban drops.
- Swap density enables < 10-minute detours for battery changes; average rider utilization materially higher than charge-only EV models.
- Merchants routinely select “low-carbon delivery” at checkout—tracked and verifiable for ESG reports and investor disclosures.
Page 5 — SME Playbook: Faster, Cheaper, Greener
- Switch the modality: move dense urban orders to electric two-wheelers first. Use vans only for bulk/long-haul.
- Cluster your drops: batch orders by micro-zone and time-window. Let routing AI compress distance and dwell time.
- Exploit swapping: choose partners with solar swap hubs to protect SLAs during peak hours and rainy-season demand spikes.
- Measure what matters: track on-time performance, cost per drop, and kg CO₂ per delivery. Make carbon a KPI, not a footnote.
- Market the impact: show “Delivered by Clean Mobility” on product pages and receipts—customers and enterprises reward transparency.
Note: We continuously update data points and projections as new official statistics, market studies, and operator milestones are released.